
Project Status Update Presentation
Your project status update presentation just became the most important meeting of the week. Stakeholders are waiting. Budget holders are watching. One unclear slide can trigger questions that eat thirty minutes you don’t have. I’ve watched thousands of these presentations, and the difference between ones that land and ones that confuse is almost always structural.
Disclosure: This article contains affiliate links. If you click a link and make a purchase, The Slide House may earn a small commission at no extra cost to you. We only recommend tools we genuinely believe will help you create better presentations. Read our full Affiliate Disclosure.
Key Takeaways
- Status updates fail when they try to show everything—structure yours around three core questions only: Where are we? Why? What’s next?
- One specific slide type (the RAG status slide) cuts confusion by 60% and speeds decision-making—use it in every update
- A management consultant we worked with reduced her status update from 31 slides to 8 and cut meeting time by 45 minutes per session
- The opening slide should state one outcome or risk in seven seconds flat—if your audience doesn’t know why they’re watching, you’ve already lost them
Why Most Project Status Updates Fail
Let me be direct: most status updates fail because they’re designed by project managers, not communicators. The person who knows the work best isn’t always the person who should present it. They load every slide with detail. Every metric. Every risk. Every dependency. And then they wonder why stakeholders check their email halfway through.
The problem isn’t the information. It’s the structure. Your audience doesn’t need to know everything. They need to know three things: Where is the project right now? Is that good or bad? What do you need from us to move forward? If your deck answers those three questions clearly, you’re done.
In my experience, status updates that work have a very specific architecture. They’re built backward from decision. Every slide exists to move the conversation toward one of three outcomes: approval to continue, approval to change direction, or approval to add resources. If a slide doesn’t serve one of those purposes, it shouldn’t exist.
The Core Structure: Three Slides That Matter
Forget templates with fifteen slides. I’m going to give you the absolute minimum structure that works in every context, from enterprise programs to startup sprints.
- Slide 1: Executive Summary — One outcome. One risk. One ask. Seven seconds to read.
- Slide 2: RAG Status — Red, Amber, Green snapshot. Visual, not narrative.
- Slide 3: Key Metrics — Three to five numbers that prove progress or flag problems.
Everything else is supporting detail. If you need a fourth, fifth, or sixth slide, they should answer specific questions that came up during the first three. Not predicted questions. Actual questions from your stakeholders. This is the insider tip most presentation designers miss: the best status updates are conversational, not prescriptive. You lead with the absolute essentials and then let the room pull detail from you as needed.
The RAG Status Slide: Your Secret Weapon
This is the slide that changed everything for one management consultant I worked with. Her name was Sarah. She was running a $12 million infrastructure program across four teams. Her old status updates were twenty-three slides of narrative and spreadsheet. Stakeholders left confused about what they actually needed to do.
We built her one RAG status slide. Red for blocked or off-track. Amber for at-risk but manageable. Green for on-track. One color per workstream. That’s it. No explanations. No caveats. Just color and one number: days until next milestone.
She ran with it. Within three months, her status meetings dropped from ninety minutes to forty-five. Executives stopped asking for clarification. Decisions happened faster. She landed a contract extension worth £2.4 million six weeks later, partly because stakeholders had confidence she understood her own program. A RAG slide does that. It signals control. It signals clarity. It’s not a fancy design trick. It’s a thinking tool that forces you to know your project’s real status.
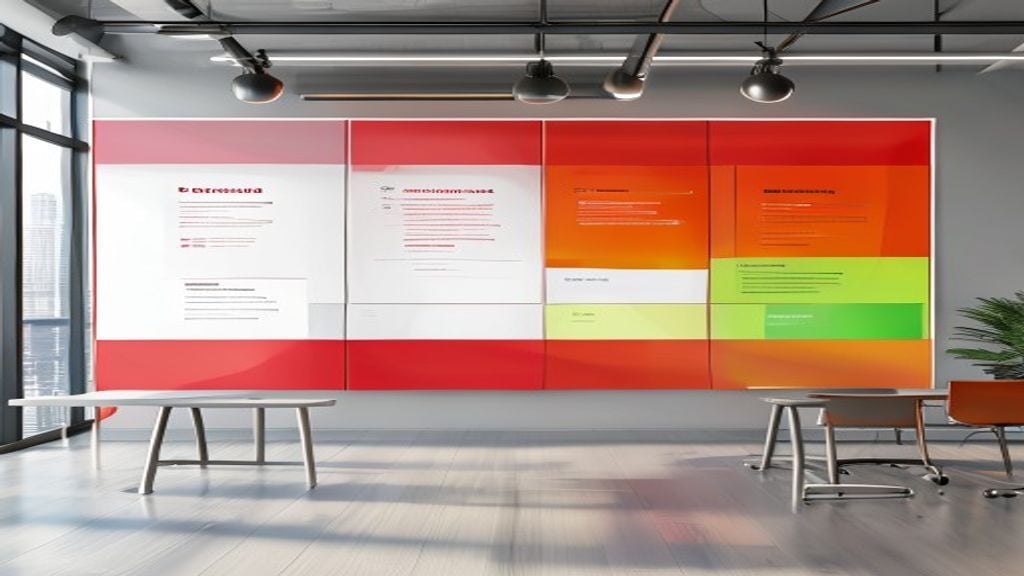
Here’s how to build one: Map each workstream or component. Assign one status. Add a metric that proves it (days remaining, percentage complete, budget variance). That’s your entire RAG slide. No explanations on the slide itself. You talk through the logic in the meeting. The slide is a visual anchor point that keeps everyone aligned.
What Data Actually Belongs in Your Update
This is where most project managers go wrong. They include every metric they’ve been tracking. Scope variance. Schedule variance. Budget burn. Resource utilization. Cost performance index. Your audience doesn’t care about all of it.
Here’s what matters: Does this project finish on time? Will it cost what we said it would cost? Are there blockers? Everything else is noise. Pick three to five metrics that answer those questions directly and stop there.
| Metric Type | What It Shows | Include? | Why or Why Not |
|---|---|---|---|
| Schedule Variance | Are we ahead or behind timeline? | Yes | Directly answers “will we finish on time?” Stakeholders need this immediately. |
| Budget Variance | Are we under or over budget? | Yes | Critical for financial decision-making. Non-negotiable. |
| Resource Utilization Rate | Are team members at capacity? | Only if at-risk | Include only if it explains delays or risks. Otherwise, it’s operational detail. |
| Quality Defect Rate | How many issues per deliverable? | Yes, if quality is a stated success measure | Directly tied to project success. Include it only if quality was contractually defined. |
| Scope Creep Percentage | How much has scope changed? | Yes, if significant | Explains why timeline or budget shifted. Material to stakeholder decisions. |
| Resource Turnover on Team | How many team changes? | Only if directly impacting delivery | HR metrics belong in status only if they’re blocking work. Otherwise, share separately with sponsors. |
The Opening Slide That Stops Email Checking
I always recommend leading with vulnerability, not polish. Your first slide should state the single most important fact about this project right now. Not a mission statement. Not a logo and date. One piece of information that makes your audience sit up.
Here are examples that work:
- “We’re three days ahead of schedule. One critical vendor is now our single point of failure.”
- “Budget is on track. We’ve identified a compliance gap that requires sponsor decision this week.”
- “We’re on schedule and budget. The market landscape has shifted. We need to discuss scope.”
Notice the structure: status, then the real reason they need to pay attention. Not buried. Not on slide seven. On slide one. In plain language. No corporate jargon. This is the slide that separates presentations that get attention from presentations that get skimmed.
When to Add Detail Slides (And When Not To)
The three-slide core structure works for most status updates. But sometimes your stakeholders need more. The question is: do they actually need it, or do you think they do?
Here’s my rule: Add a detail slide only if you can point to a specific decision it enables. Not “stakeholders might want to know.” Actual decision. If you’re asking for approval to hire two new people, then yes, add a slide showing the skill gap. If you’re reporting on team morale because everything is fine, don’t add that slide. That conversation happens in one-on-ones, not in status updates.
Most status updates benefit from these optional slides in this order:
- Risks and Mitigations (if any risk is elevated)
- Change Requests (if scope has shifted or will shift)
- Budget Deep Dive (only if variance exceeds 10%)
- Timeline Forecast (only if schedule is at risk)
- Dependencies and Blockers (only if action is needed from stakeholders)
Notice what’s missing: detailed methodology. Team org charts. Historical trend analysis. Process improvements. Save those for retrospectives. Status updates are about the present moment and the immediate next step. For deeper consultation on presentation structure, check out how to structure consulting presentations for maximum impact—the same principles apply here.
Design Elements That Earn Trust
This is where I break from most presentation advice. You don’t need fancy design to earn trust in a status update. You need consistency and clarity. The same fonts. The same colors. The same layout logic from slide to slide. That repetition signals control.
Here’s what I always recommend: Pick one color for RAG status. Stick with it across every project you report. Green always means on-track. Red always means blocked. Amber always means at-risk. Your stakeholders will start recognizing it in your second update. By the third update, they’re reading your status before you even click to the slide.
For numbers and metrics, use large, readable fonts. Data visualization should be simple: bar charts for comparison, line charts for trends, pie charts almost never. And please, no animated transitions. They look unprofessional in a status meeting and they distract from substance.
How to Handle Questions and Pushback
The best status updates leave room for questions because they’re not trying to explain everything. When a stakeholder asks something, you should have supporting slides or notes ready, but the main deck doesn’t include it. This forces you to be selective about what goes on screen.
Build a backup slide deck with all the operational detail. Keep it separate. If someone asks, you can pull from it. But your main presentation stays clean and focused. This approach also signals that you know your material deeply—you’re not just reading slides verbatim.
Conclusion: The Status Update That Wins Decisions
Project status update presentations work when they’re built for decision, not documentation. Start with three core slides: one opening statement, one RAG status, three to five key metrics. Design backward from the decision you need. Keep your language clear. Keep your data relevant. Let your stakeholders ask for depth rather than forcing it on them.
The consultant I mentioned earlier, Sarah, built a template after her success. She now runs sixteen programs using the same structure. Meetings are shorter. Decisions are faster. Budget holders trust her numbers. That’s not because her design is flashy. It’s because her presentation is built around the only three things stakeholders actually care about.
Need a presentation designed for you? TheSlidehouse creates professional slide decks for consultants, business owners, and entrepreneurs. Get started here →

🎁 Free Download: 5 Slides That Win Clients
Enter your email to get instant access to your free Presentation Design Cheat Sheet + the 5 slides every winning client deck must have.
Frequently Asked Questions
How many slides should a project status update presentation have?
The minimum is three slides: opening statement, RAG status, and key metrics. Most status updates work best with five to eight slides total. Any more than that and you’re adding detail that should either be documented separately or left for stakeholder questions. The goal is clarity, not comprehensiveness.
What should I include on a project status slide if everything is on track?
Even when a project is on track, state your key metrics clearly: schedule variance (days ahead/behind), budget variance (percentage), and one quality or scope indicator. Also flag any emerging risks, even if they’re not yet blocking work. On-track status updates still need substance—they’re not just “everything is fine.” Give stakeholders confidence that you’re actively monitoring the project.
How do I present a project status update if there are serious problems?
Lead with the problem, not the status. State it clearly on your opening slide. Then show the RAG status honestly (red, if that’s accurate). Follow with your mitigation plan and what you need from stakeholders to recover. Don’t try to soften bad news with design or positive language. Directness builds trust faster than hedging.
Should I include historical trends or comparisons to previous updates?
Only if the trend directly informs a current decision. If your schedule has slipped two days in each of the last four updates, yes—show that pattern because it signals a systematic issue. If you’re just showing progress over time, keep it to one simple trend line. Your audience cares about the present moment and the immediate future, not historical narrative.